Thursday, 9 May 2019

Installation guide for Anaconda, Python, OpenCV and fmask for interpreting Sentinel Images


Download and Install Anaconda available at: https://www.continuum.io/downloads During installation, make sure you include Python in the path:
- Run Anaconda Prompt as an Administrator to be able to install new libraries and run the following commands:
:$ conda install -c conda-forge gdal

Install Jypiter Notebook:
:$ conda install -c conda-forge jupyterlab
Run JypiterLab:
:$ jupyter-lab

Install opencv:
:$ conda install -c menpo opencv
You may need to run the above command using an Administrator Command Prompt


For reading .nc images of Sentinel 3:
:$ conda install -c conda-forge netcdf4


Install fmask from Administrator Command Prompt as follow:
:$ conda config --add channels conda-forge
:$ conda install -c conda-forge python-fmask
or (to be tested)
:$ conda create -n myenv python-fmask
:$ activate myenv


Other dependencies:
:$ conda install -c anaconda scipy
:$ conda install -c anaconda numpy
:$ conda install -c conda-forge matplotlib
:$ conda install scikit-learn


For Doxygen Documentation please install it from here: http://www.stack.nl/~dimitri/doxygen/download.html


Every time you run your scripts, you need to run Anaconda Prompt as an Administrator and run "activate myenv".


Once you activate myenv, check they version of python that you are using. There is a bug in recent anaconda versions and when myenv is activated, your python is automatically updated to 3.6. You may use the following command to downgrade it:
:$ conda install python=2.7.8
Please note that this may be risky, since other applications may depend on Python 3.6.


Acknowledgement

This is part of the H2020 Research Innovation and Staff Exchange project SEO-DWARF with reg. no MSCA-RISE-691071. Website: seo-dwarf.eu
Monday, 8 April 2019

Histograms with R


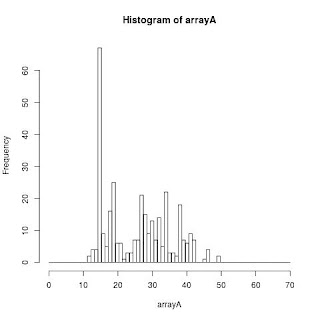
This is an example of a histogram creation using R that I would like to save in my blog for quickly referring to it when required.


# Run the script using the following command:
# Rscript Histogram.r

# Define an array
arrayA<-c(17.6,16.8,33.6,28,33.6,28,40.8,37.6,38.4,30.4,25.6,23.2,28,16,15.2,24,16.8,32,28,15.2,15.2,28,28.8,15.2,24.8,15.2,14.4,29.6,38.4,19.2,27.2,37.6,15.2,33.6,33.6,28,18.4,17.6,26.4,26.4,36.8,24.8,32,19.2,16,33.6,32,16,16,30.4,16,37.6,16,25.6,27.2,28,24,26.4,26.4,20.8,16.8,26.4,28,32.8,24,15.2,15.2,16,27.2,12,40.8,38.4,40.8,40,15.2,37.6,17.6,17.6,27.2,14.4,15.2,20,19.2,26.4,27.2,14.4,31.2,27.2,28.8,15.2,15.2,14.4,14.4,28.8,24.8,14.4,15.2,14.4,19.2,31.2,18.4,28.8,17.6,17.6,17.6,17.6,17.6,17.6,32,31.2,32,46.4,37.6,40.8,39.2,17.6,17.6,17.6,18.4,17.6,17.6,34.4,34.4,16.8,16.8,15.2,39.2,40.8,29.6,42.4,40.8,40,38.4,42.4,15.2,15.2,16,15.2,34.4,14.4,14.4,14.4,30.4,42.4,48.8,14.4,32,28,28,14.4,14.4,25.6,22.4,29.6,28,31.2,26.4,26.4,25.6,14.4,14.4,14.4,18.4,19.2,19.2,18.4,39.2,15.2,30.4,28.8,33.6,32.8,15.2,33.6,32,32,32.8,31.2,33.6,15.2,24.8,40.8,40.8,39.2,26.4,25.6,18.4,18.4,40.8,37.6,19.2,19.2,37.6,19.2,28.8,28.8,24.8,28,15.2,14.4,31.2,19.2,18.4,19.2,19.2,19.2,32,37.6,14.4,12.8,30.4,15.2,14.4,40,27.2,30.4,38.4,20.8,40,20,20.8,40,41.6,32.8,20.8,20.8,39.2,20.8,20,36,20,19.2,34.4,32,20,20,30.4,26.4,21.6,32,15.2,15.2,28.8,24.8,29.6,17.6,27.2,30.4,33.6,13.6,33.6,35.2,27.2,28,16,15.2,15.2,15.2,28,31.2,38.4,25.6,38.4,29.6,15.2,15.2,32.8,33.6,33.6,26.4,14.4,28.8,34.4,33.6,15.2,32,40,33.6,13.6,15.2,37.6,35.2,14.4,32,15.2,33.6,18.4,22.4,38.4,18.4,36.8,14.4,25.6,14.4,33.6,15.2,26.4,24.8,28,36,39.2,14.4,33.6,11.2,15.2,49.6,35.2,36,46.4,46.4,14.4,46.4,12.8,45.6,15.2,41.6,14.4,41.6,14.4,13.6,37.6,12.8,39.2,41.6,14.4,12.8,13.6,14.4,14.4,14.4,18.4,14.4,32)


# 1. Open jpeg file

jpeg("/home/username/Documents/histArrayA.jpg")


# 2. Create the plot inside the file

hist(arrayA,breaks=seq(0,70,l=70))


# 3. Close and save file

dev.off()


The output of the above script is the following:


Acknowledgments:

The script of this post was written as part of the "FOREST" project with reg. no OPPORTUNITY/0916/0005. The "FOREST" project  is co-financed by the European Regional Development Fund and the Republic of Cyprus through the Research Promotion Foundation.

Friday, 8 February 2019

Reviewers please be kind!

Academia is a very competitive world and it is something that many people, including my self, do not understand when they start a doctorate degree. Competitiveness is OK since we learn how to accept failure and be persistent in getting this work publish. But sometimes I feel disappointed when I receive the comments of the reviewers, not because they rejected my paper, but because they did not even read the entire article and it is clear from their comments! I think more people may resemble to this experience. So, I decided to write this post and ask reviewers to carefully read the entire articles, be kind and encouraging while recommending ways of making the work publishable.

Personally, I am new researcher and I have not written enough papers to fully understand the process and avoid small mistakes. But if reviewers do not help me improve myself then I will never be able to progress my career in academia.

Here are some comments that I found disturbing:
-  This is from a paper that have been rejected before even been reviewed: "a link to bird diversity is offered as motivation, the link to remote sensing is not pursued further in the manuscript". The article was about proposing a new methodology for detecting dead trees from full-waveform LiDAR data. If LiDAR is not about remote sensing then what could it be? By only rephrasing the abstract and submitting it to another high impact journal the article was published with minor corrections, indicating that the editor had not read the article.

- "The LiDAR-specific complications of mapping full-waveform data to scalar volumes are entirely handle by DASOS. It means means that the manuscript oversells its contribution" The reviewer missed the part that DASOS was implemented by the authors of the manuscript to make the research possible!

- "Evaluation of the method is completely insufficient," could have been phrased in a kinder way, especially when the reviewer request comparison with Canny Edge that it included in the article. On top of that the reviewer states "While Canny was considered, its awful results in table 3 indicates that it was implemented incorrectly or using a poor choice of settings." How is it possible for the standard python opencv function for the Canny Edge algorithm to be incorrectly implemented? The reviewer could have request instead an explanation for the bad results, which exists: the Canny Edge includes a smoothing step and the gradient differences are low. Therefore, Canny Edge fails to detect many edges!

- The same reviewer questions the approach used to find k for k-means and that it may not be reliable, but missed the part that the mean shift was also implemented in the article that does not require the number of clusters (k) to be pre-defined. 


Do not get me wrong, there are reviewers that provide constructive feedback that help improve a paper. I just feel that more reviewers should act like that. Behind every article, there is a researcher who spent months reading articles, conducting experiments, stressing with every unexpected results, missing social events hoping that the code will work this time and spending nights overworking to finish with the writing. So be kind to them! I understand that I and every young researcher makes mistakes. My articles usually lack of presentation, but if reviewers are judgmental and badly criticizing my work without even reading the entire articles, then how will I improve myself?