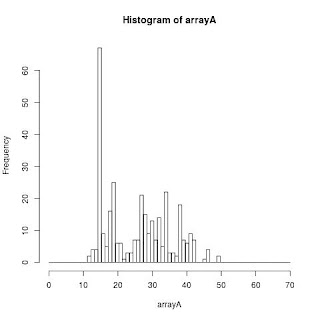
This is an example of a histogram creation using R that I would like to save in my blog for quickly referring to it when required.
# Run the script using the following command:
# Rscript Histogram.r

# Define an array
arrayA<-c(17.6,16.8,33.6,28,33.6,28,40.8,37.6,38.4,30.4,25.6,23.2,28,16,15.2,24,16.8,32,28,15.2,15.2,28,28.8,15.2,24.8,15.2,14.4,29.6,38.4,19.2,27.2,37.6,15.2,33.6,33.6,28,18.4,17.6,26.4,26.4,36.8,24.8,32,19.2,16,33.6,32,16,16,30.4,16,37.6,16,25.6,27.2,28,24,26.4,26.4,20.8,16.8,26.4,28,32.8,24,15.2,15.2,16,27.2,12,40.8,38.4,40.8,40,15.2,37.6,17.6,17.6,27.2,14.4,15.2,20,19.2,26.4,27.2,14.4,31.2,27.2,28.8,15.2,15.2,14.4,14.4,28.8,24.8,14.4,15.2,14.4,19.2,31.2,18.4,28.8,17.6,17.6,17.6,17.6,17.6,17.6,32,31.2,32,46.4,37.6,40.8,39.2,17.6,17.6,17.6,18.4,17.6,17.6,34.4,34.4,16.8,16.8,15.2,39.2,40.8,29.6,42.4,40.8,40,38.4,42.4,15.2,15.2,16,15.2,34.4,14.4,14.4,14.4,30.4,42.4,48.8,14.4,32,28,28,14.4,14.4,25.6,22.4,29.6,28,31.2,26.4,26.4,25.6,14.4,14.4,14.4,18.4,19.2,19.2,18.4,39.2,15.2,30.4,28.8,33.6,32.8,15.2,33.6,32,32,32.8,31.2,33.6,15.2,24.8,40.8,40.8,39.2,26.4,25.6,18.4,18.4,40.8,37.6,19.2,19.2,37.6,19.2,28.8,28.8,24.8,28,15.2,14.4,31.2,19.2,18.4,19.2,19.2,19.2,32,37.6,14.4,12.8,30.4,15.2,14.4,40,27.2,30.4,38.4,20.8,40,20,20.8,40,41.6,32.8,20.8,20.8,39.2,20.8,20,36,20,19.2,34.4,32,20,20,30.4,26.4,21.6,32,15.2,15.2,28.8,24.8,29.6,17.6,27.2,30.4,33.6,13.6,33.6,35.2,27.2,28,16,15.2,15.2,15.2,28,31.2,38.4,25.6,38.4,29.6,15.2,15.2,32.8,33.6,33.6,26.4,14.4,28.8,34.4,33.6,15.2,32,40,33.6,13.6,15.2,37.6,35.2,14.4,32,15.2,33.6,18.4,22.4,38.4,18.4,36.8,14.4,25.6,14.4,33.6,15.2,26.4,24.8,28,36,39.2,14.4,33.6,11.2,15.2,49.6,35.2,36,46.4,46.4,14.4,46.4,12.8,45.6,15.2,41.6,14.4,41.6,14.4,13.6,37.6,12.8,39.2,41.6,14.4,12.8,13.6,14.4,14.4,14.4,18.4,14.4,32)


# 1. Open jpeg file

jpeg("/home/username/Documents/histArrayA.jpg")


# 2. Create the plot inside the file

hist(arrayA,breaks=seq(0,70,l=70))


# 3. Close and save file

dev.off()
The output of the above script is the following:

No comments:
Post a Comment